Customer Overview
The Overview page gives you a summary view of all domains' activity and a list of your domain in the All Domains table.
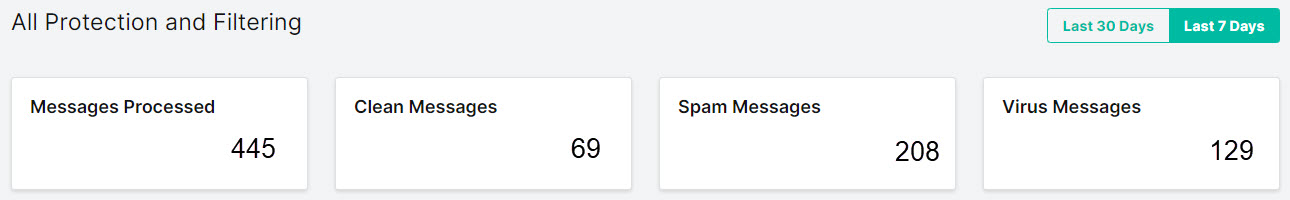
All Protection and Filtering shows a summary of emails for all domains that was processed through SpamTitan over the Last 7 Days. Select Last 30 Days to show summary data for the last thirty days.
You must have added at least one domain with an active email flow to see summary data.
The Quick Actions bar allows you to quickly add a new domain or add an email to your Allow & Block List.

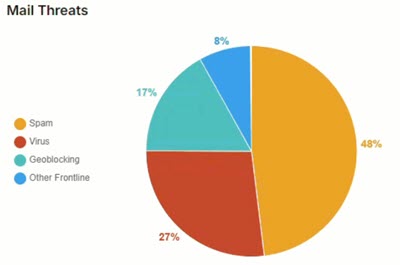
The Mail Threats pie chart shows the percentage of non-clean messages being processed over the last seven or thirty days (default: Last 7 Days). Categories include: Spam messages; virus messages; geoblocking; HELO reject; RBL reject and other frontline reject.
The Processed Messages graph shows details your mail processing over the last seven or thirty days (default: Last 7 Days).
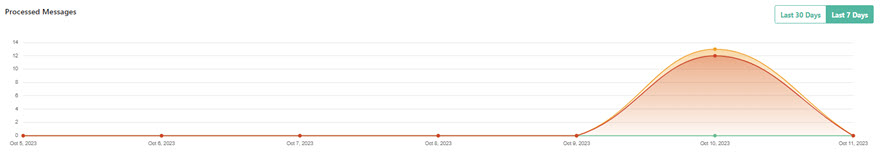
Select and unselect the labels to add and remove an item from the graph:

All Domains is a list of all your domains. Select the column  icon to display the All Domains table column names. Slide each on and off to view or hide a column.
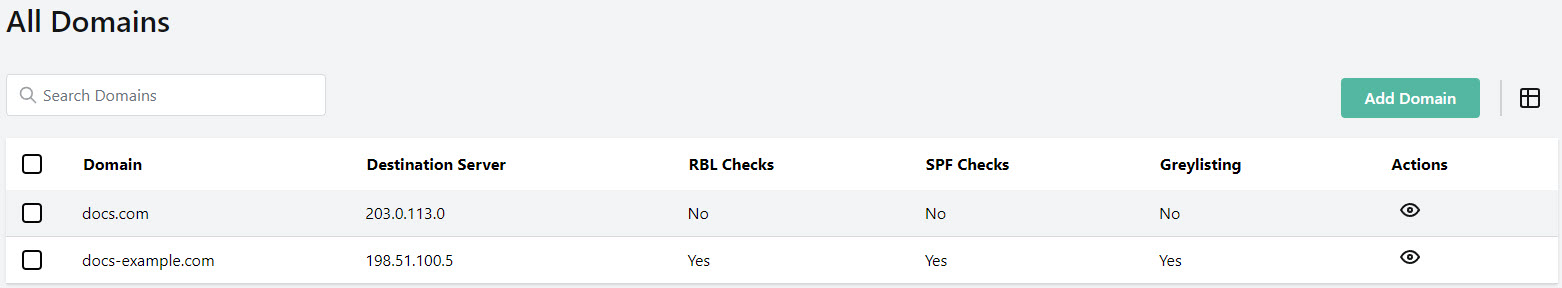
Domain: Name of the domain.
Destination Server: Address of the destination server.
MX Status: The MX records of your added domains must point to SpamTitan. This is because any domain that uses email has an MX record, which lists the mail servers available to accept mail for that domain. The MX Status indicates the following three levels of MX completion:
Active MX records point to SpamTitan. No further action is required.
Inactive: Indicates that MX records are not pointing to SpamTitan. See Change your MX Records for further information.
Partial: Indicates that the MX record for the domain is pointing both to SpamTitan and to other mail servers. This means that if other mail servers have a lower priority MX record, email can potentially be sent to them and bypass SpamTitan filtering. See Change your MX Records for further information.
Enforced 2FA: Indicates if 2FA is mandatory for users to access SpamTitan.
RBL Checks: Indicates if the RBL (Realtime Blackhole List) test is enabled. The RBL test checks the IP address of all mail servers sending mail to the domain against lists of known spammer IP addresses. See Edit your Domain Configuration for information.
SPF Checks: Indicates if SPF (Sender Policy Framework) test is enabled. The test checks the SPF record of the sending domain to ensure the IP of the sender is allowed for the domain and if not, it rejects the mail. See Edit your Domain Configuration for information.
Greylisting: Indicates if greylisting is enabled for this domain. Greylisting temporarily rejects all email and requires the sending server to send it again after 5 minutes. See Edit your Domain Configuration for information.
Actions: Select the view
 icon in the Actions column for a domain to drill down to the domain level to view and further manage that domain.
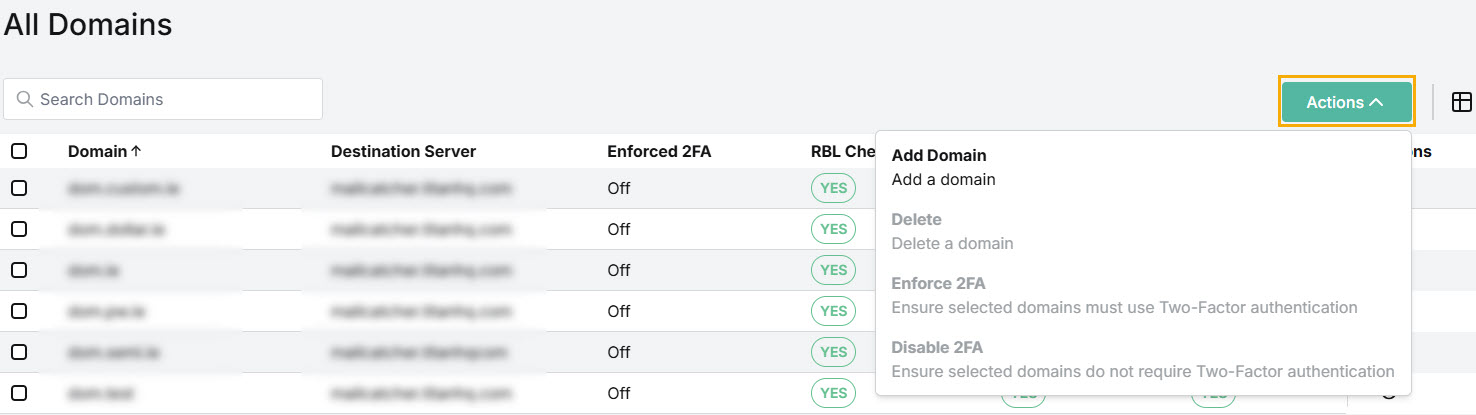
From the Actions dropdown menu, you can add and delete domains, and enable and disable enforced 2FA for domains.
Follow the links below for further details.