Summary Report
The summary report shows a snapshot of DNS requests over the last thirty days. This allow you to monitor any increases or decreases in usage over time, as well as any trends in allowed and blocked requests. Go to Reporting > Summary to view:
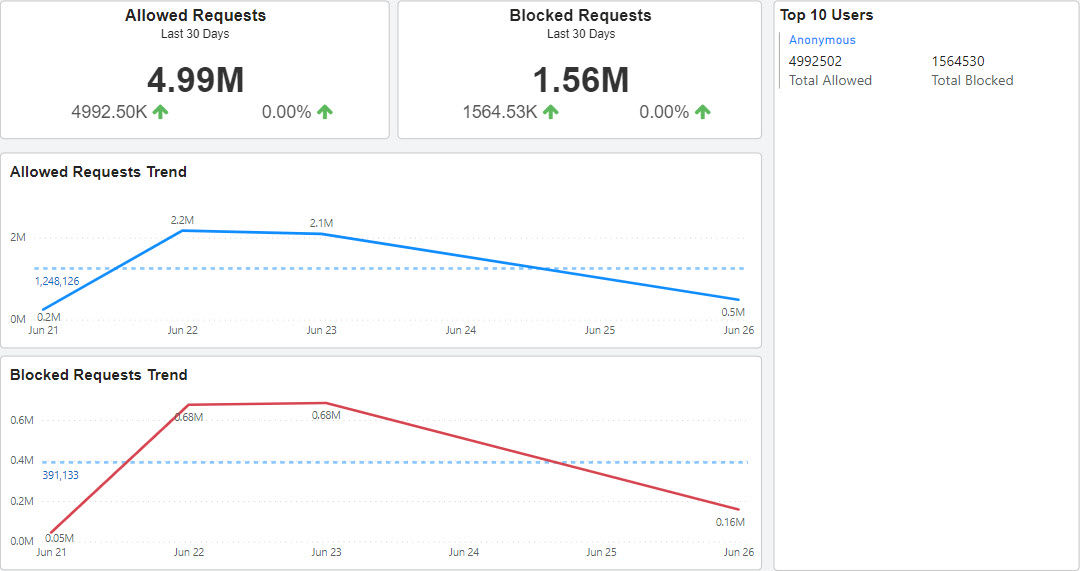
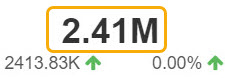
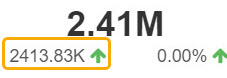
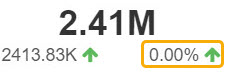
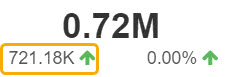
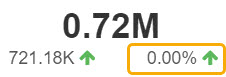
Allowed Requests | Allowed requests shows the following information:
|
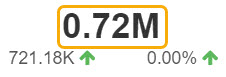
Blocked Requests | Blocked requests shows the following information:
|
Allowed Requests Trend | The trend of allowed requests over the last thirty days. 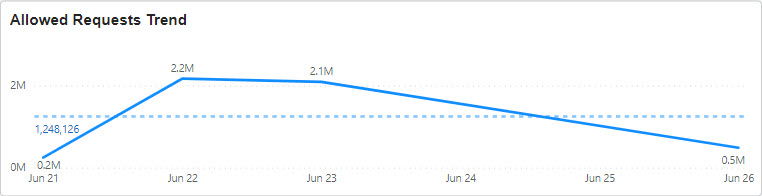 |
Blocked Requests Trend | The trend of blocked requests over the last thirty days. 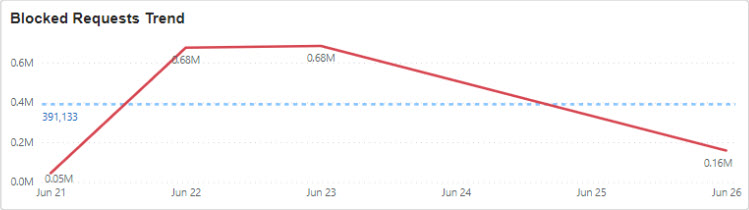 |
Top 10 Users | The top ten users over the last thirty days. 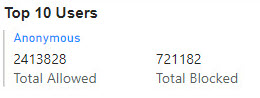 |