
Phishing Simulation Monthly Reports
As an MSP admin, you'll be emailed a monthly Excel report with details of your active phishing simulation campaigns. You can see a summary for all your customers in the Summary tab and individual customer data in subsequent tabs.
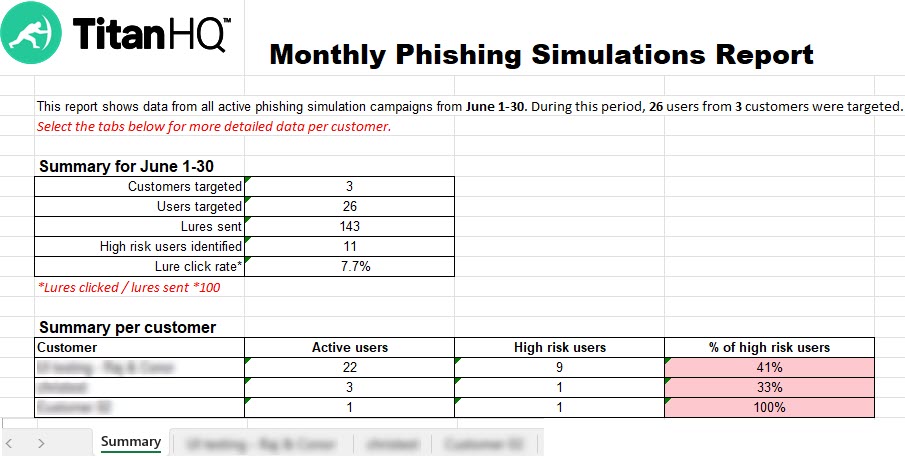
The Summary tab displays the following details:
Customers targeted: Number of customers enrolled in your active phishing campaigns who received lures this month.
Users targeted: Combined total of all your customers' users enrolled in your active phishing campaigns who received lures this month.
High risk users identified: Number of users who have interacted with a lure this month.
Lure click rate: Indicates the percentage of recipients who interacted with a lure. The percentage is calculated by dividing the number of lures clicked by the number of lures sent and multiplying by 100.
The Summary per customer section shows:
High Risk Users: Number of customer's users who haven't completed their assigned modules before the completion date.
% of high risk users: Percentage of high risk users belonging to that customer.
By selecting the tabs at the bottom of the file, you can see data that is specific to individual customers.
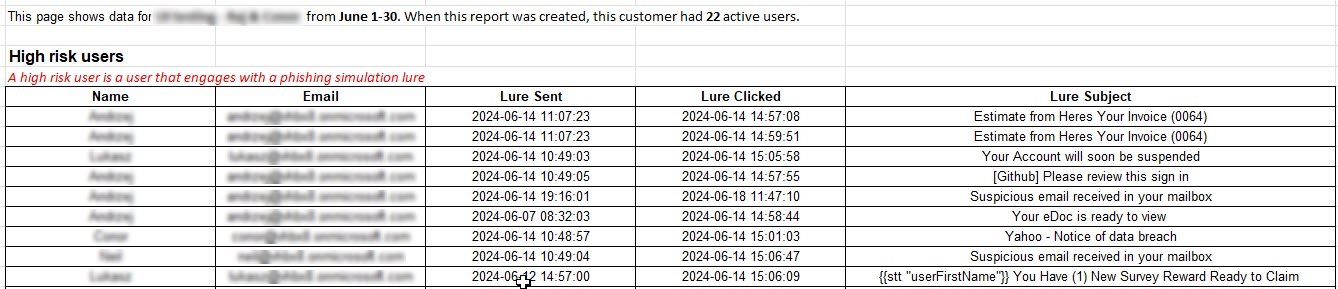
A list of your customer's users is displayed who are considered to be high risk. A high risk user is a user who engages with a phishing simulation lure.
Name: Name of the high risk user.
Email: The high risk user's email address.
Lure Sent: Date and time that lure was sent.
Lure Clicked: Date and time that the high risk user interacted with the lure.
Lure Subject: Subject name of the lure.
Reactive Module Name: Name of the security awareness training module the high risk user is enrolled in.
Status: Indicates the state of the SAT campaign.

The training module has been assigned, and the link is active, but not completed.

User has completed the training module on time.

The campaign completion date has passed, and the training module link has expired and hasn't been completed.
Completed Date Time: Date and time that the training was completed.