Email Security Customer Overview
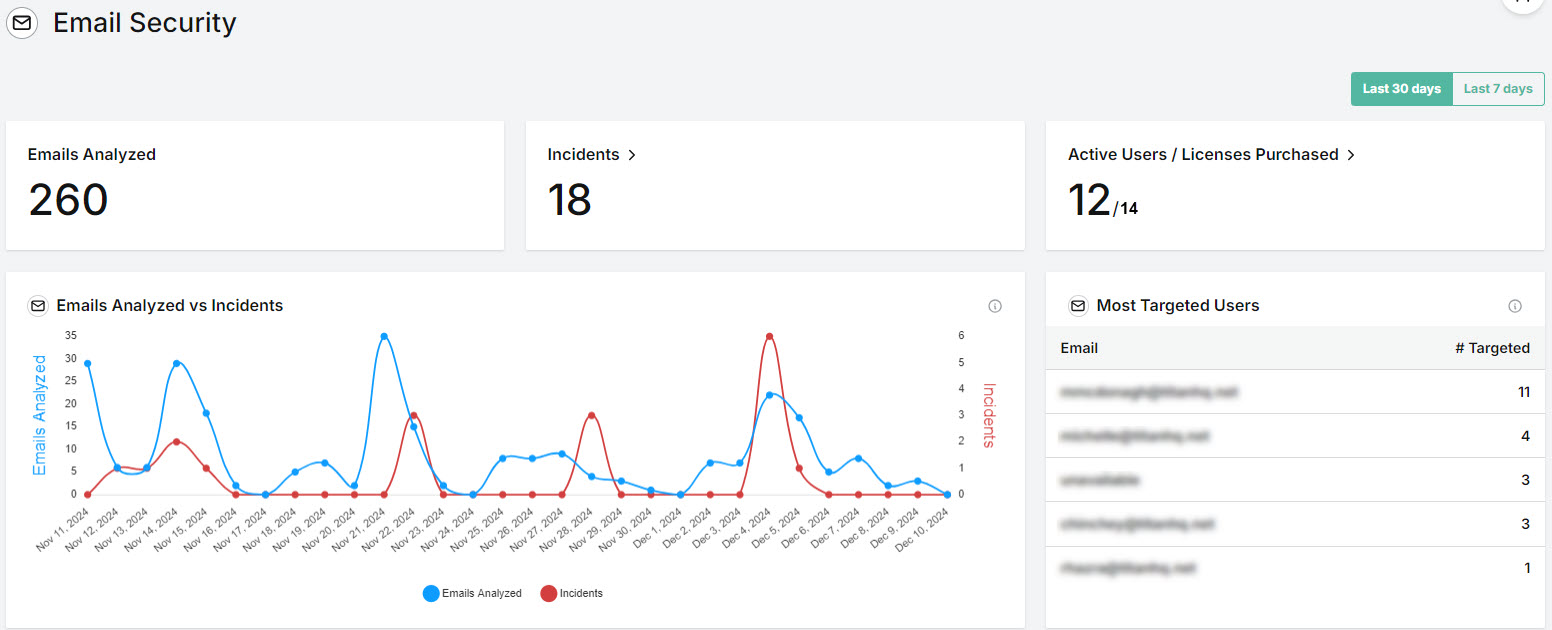
As a Customer Admin, go to Email Security > Overview to see a summary of user activity. The default view is the last 30 days, but you can change this be selecting Last 7 Days in the upper right corner.

Emails Analyzed
The total number of emails processed for the selected time period.
Note
This number is based on the email count and not the number of recipients who received the email. For example, if an email has 5 recipients, the email is only counted once.

Incidents
Total number of phishing emails received for the selected time period in the Incidents section. Select this box to go to Incidents, where you can view, resolve, and manage incidents.

Active Users/Licenses Purchased
Compare the total number of your active users to the number of licenses you purchased from your MSP. Select this box to go to License Usage where you can monitor your relationship with your users based on licenses and usage.

Emails Analyzed vs Incidents

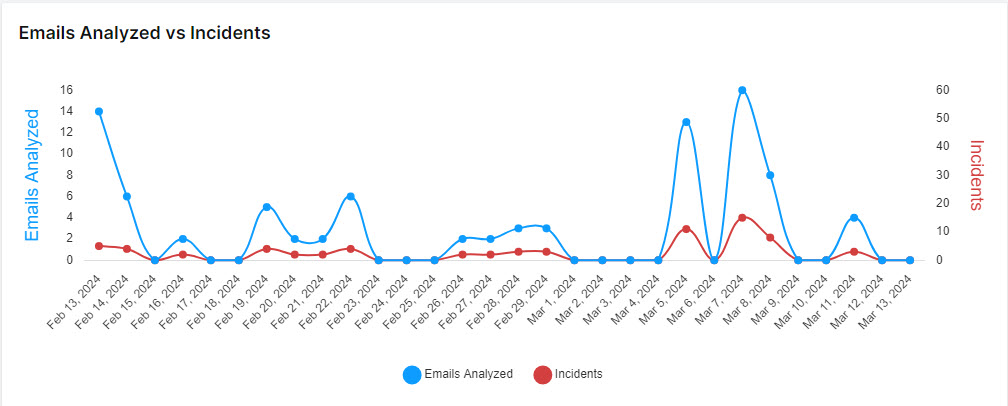
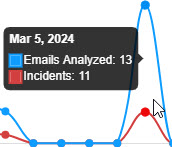
Hover your mouse over the graph to display a summary for a particular date.

Select and de-select the labels to add and remove items from the graph.

Most Targeted Users
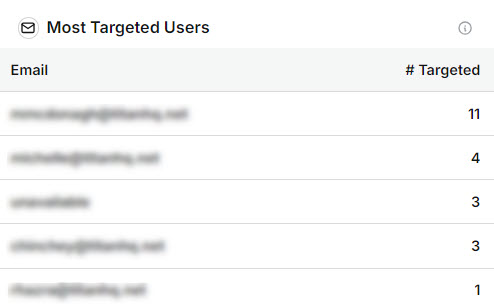
View a list of the most attacked email addresses, with the most targeted user listed first. The # Targeted column indicates the number of malicious emails sent to the user.

