Customer Admin Reports
As a customer admin, you can query data related to your SAT and Phishing Simulation users and the campaigns they've been enrolled in by selecting Report Manager in your left navigation menu.
Select either Security Awareness Training or Phishing Simulation from the Solution dropdown menu to view the following types of reports:
For Security Awareness Training:
User Completion Summary: View data for users who have been enrolled in SAT, including the number of campaigns users have been included in; the number of modules assigned; the number of modules completed on time, and percentages of modules completed.
User Completion by Campaign: View statistics for some or all of your users based on the campaigns they've been enrolled in.
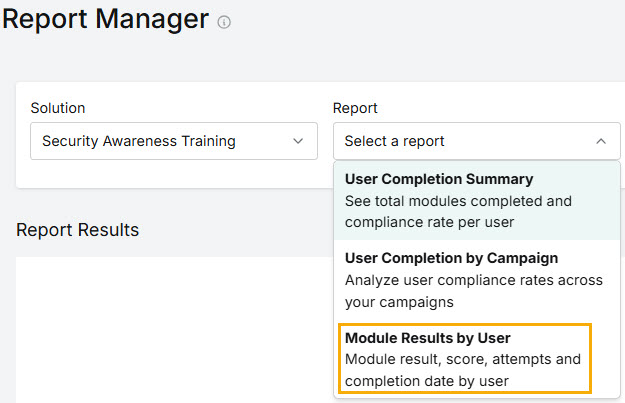
Module Results by User: View training completion data for some or all of your users. Data covering module results, scores, attempts and completion dates are provided in the report.
For Phishing Simulation:
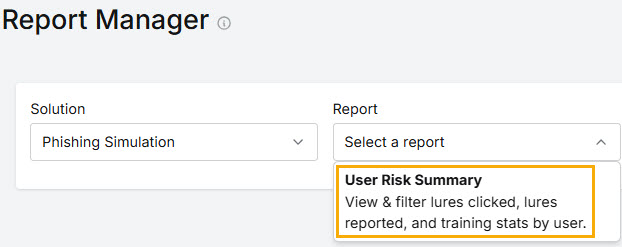
User Risk Summary: View data for users enrolled in active phishing campaigns, including the number of modules sent and completed; compliance rate; the number of lures sent, clicked and reported; and the percentage of lures clicked and reported.
User Completion Summary
As a customer admin, you can run a User Completion Summary and view the results in your SAT interface. The report provides details such as the number of campaigns users have been included in; the number of modules assigned; the number of modules completed on time, and the percentages of modules completed.
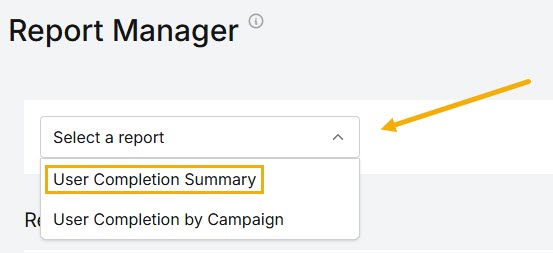
Go to Report Manager and from the Solution dropdown menu, select Security Awareness Training. From the Report dropdown menu, select User Completion Summary.
You can run a report on All Users or click on the Users dropdown menu to select specific SAT users.
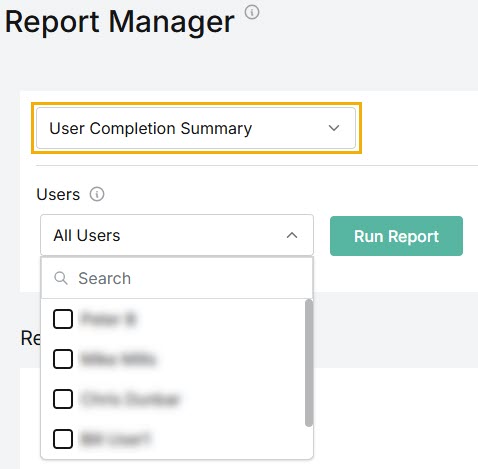
Scroll the list to find specific users or use the Search
 box.
box.Select the user(s) you want to include in the report results by clicking the checkbox(es) beside them.
Select Run Report. The Report data is displayed as follows:
User: Name of user assigned security awareness training.
Email: Email address of the user.
Campaigns: Total number of campaigns the user has been enrolled in.
Modules: Total number of modules assigned to the user.
Completed: Number of modules completed on time.
% Completed: Percentage of modules completed by the user.
Not Completed: Number of modules not completed on time. (By default, this column is hidden. Go to the
 column icon, as described below, to display this data.)
% Not Completed: Percentage of modules not completed on time. (By default, this column is hidden. Go to the
column icon, as described below, to display this data.)
You can manage how the table is displayed as follows:
Select the column
icon to manage table columns. By default, all columns are arranged in a specific order. You can change the display by doing the following:Select or deselect the checkbox beside a column name to show or hide a column.
Use the reordering
 icon to move columns up and down the list. This changes the left-to-right display. An item at the top of the list, for example, means that it will be the first column on the left. Select Reset Order to restore the columns to their default positions.
Resize columns by hovering your cursor over the column boundary you want to adjust until it becomes a resize
 cursor. Drag the boundary until the column is the width you want.
Select the up/down
 arrows in the column headers to sort column content.
To download and save a copy of the results, select Download . You have the option to save the report as either a PDF or CSV file.
User Completion by Campaign
As a customer admin, you can query the data for users based on the SAT campaigns they've been enrolled in and view the results in your SAT interface.
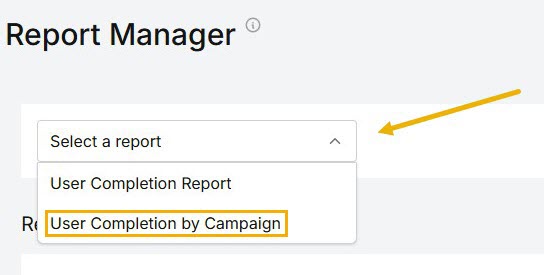
Go to Report Manager and from the Solution dropdown menu, select Security Awareness Training. From the Report dropdown menu, select User Completion by Campaign.
Two filter menus appear, from which you can make selections to produce a concise set of results:
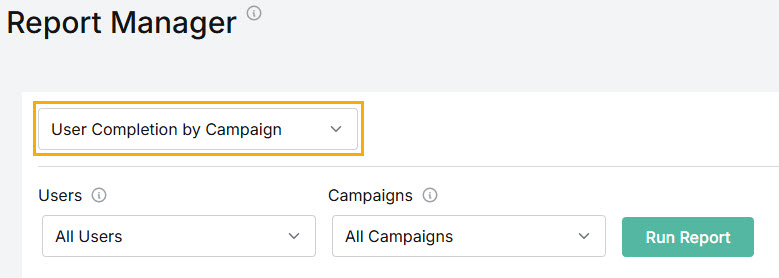
Users: When you select this dropdown menu, you'll see a a list of your SAT users.
Scroll the list to find specific users or use the Search
box.Select the user(s) you want to include in the report results by clicking the checkbox(es) beside them.
Campaigns: Select the Campaigns dropdown menu to see a list of all the campaigns your users have been enrolled in.
Scroll the list to find specific campaigns or use the Search
box.Select the campaigns(s) you want to include in the report results by clicking the checkbox(es) beside them. Alternatively, you can run a report using the default option All Campaigns.
For example, you can run a report for all users across all campaigns, or you can just select one user and view their data in one or more campaigns.
Select Run Report. The Report data is displayed as follows:
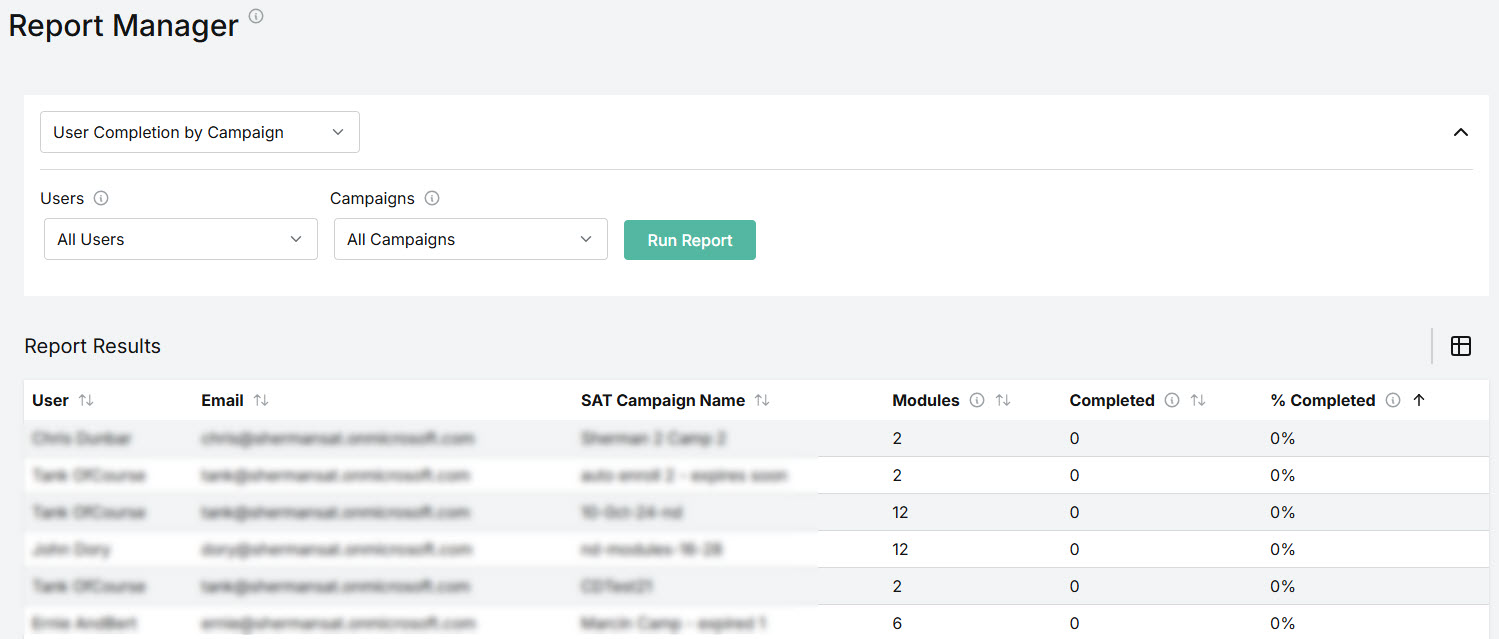
User: Name of user assigned security awareness training.
Email: Email address of the user.
SAT Campaign Name: Name of the SAT campaign user has been enrolled in.
Modules: Total number of modules assigned to the user.
Completed: Number of modules completed on time.
% Completed: Percentage of modules completed by the user.
Not Completed: Number of modules not completed on time. (By default, this column is hidden. Go to the
column icon, as described below, to display this data.)% Not Completed: Percentage of modules not completed on time. (By default, this column is hidden. Go to the
column icon, as described below, to display this data.)
You can manage how the table is displayed as follows:
Select the column
icon to manage table columns. By default, all columns are arranged in a specific order. You can change the display by doing the following:Select or deselect the checkbox beside a column name to show or hide a column.
Use the reordering
icon to move columns up and down the list. This changes the left-to-right display. An item at the top of the list, for example, means that it will be the first column on the left. Select Reset Order to restore the columns to their default positions.
Resize columns by hovering your cursor over the column boundary you want to adjust until it becomes a resize
cursor. Drag the boundary until the column is the width you want.Select the up/down
arrows in the column headers to sort column content.
To download and save a copy of the results, select Download . You have the option to save the report as either a PDF or CSV file.
Module Results by User
As a customer admin, you can run a Module Results by User report to gain insight to your users' training completion. Data covering module results, scores, attempts and completion dates are provided in the report.
Go to Report Manager and from the Solution dropdown menu, select Security Awareness Training. From the Report dropdown menu, select Module Results by User.
Three filter menus appear, from which you can make selections to produce a concise set of results:
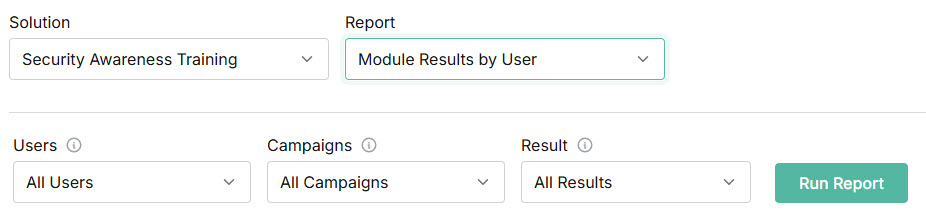
Users: When you select this dropdown menu, you'll see a a list of your SAT users.
Scroll the list to find specific users or use the Search
box.Select the user(s) you want to include in the report results by clicking the checkbox(es) beside them.
Campaigns: Select the Campaigns dropdown menu to see a list of all the campaigns your users have been enrolled in.
Scroll the list to find specific campaigns or use the Search
box.Select the campaigns(s) you want to include in the report results by clicking the checkbox(es) beside them. Alternatively, you can run a report using the default option All Campaigns.
Result: Select the dropdown menu and select the result you want to include in the report.
For example, you can run a report for all users across all campaigns, or you can just select one user and view their data in one or more campaigns.
Select Run Report. The Report data is displayed as follows:
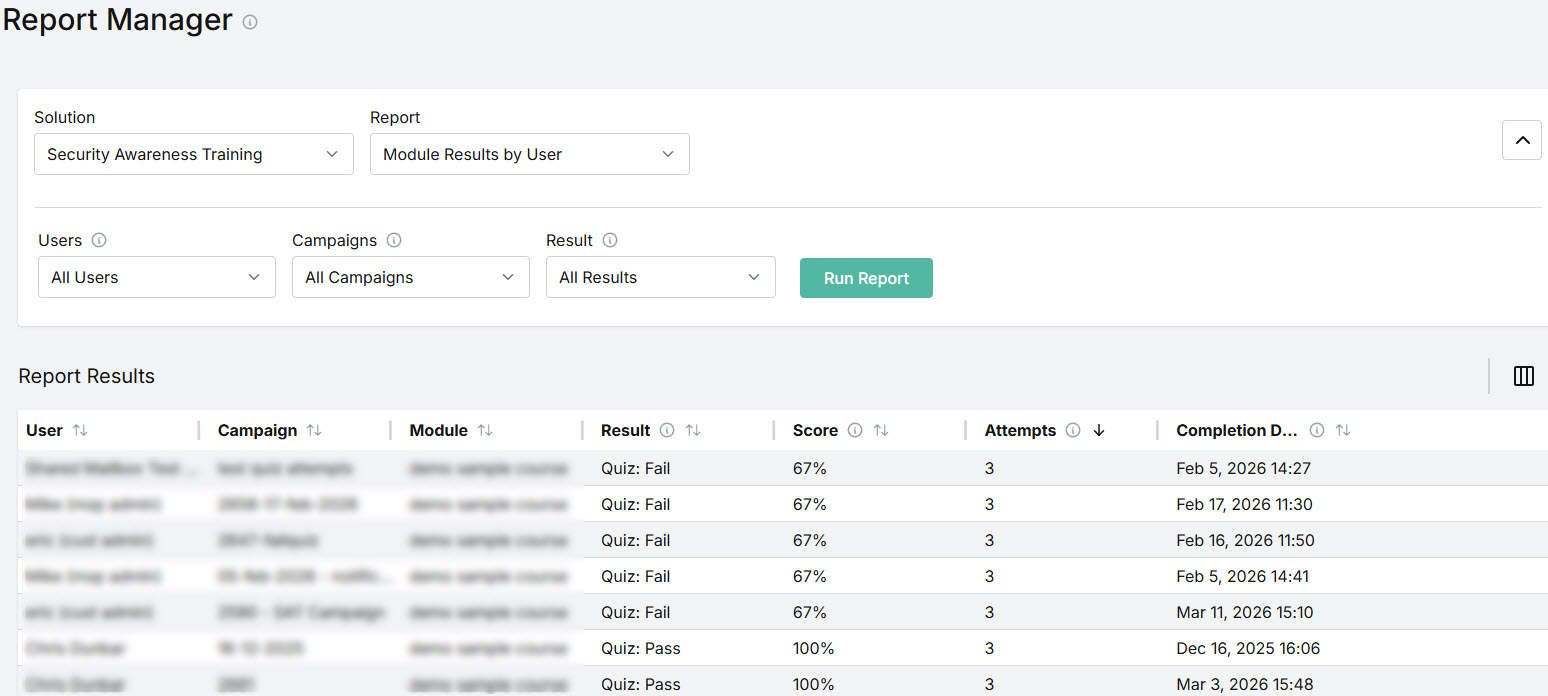
User: Name of user assigned security awareness training.
Email: Email address of the user. (By default, this column is hidden. Go to the column icon, as described below, to display this data.)
Campaign: Name of the SAT campaign user has been enrolled in.
Module: Name of the module assigned to the user.
Result: User's result for the module.
Score: User's score for last quiz attempt.
Attempts: Number of attempts by user to complete module. A maximum of three attempts is allowed.
Completion Date: Date when user completed the module.
You can manage how the table is displayed as follows:
Select the column
icon to manage table columns. By default, all columns are arranged in a specific order. You can change the display by doing the following:Select or deselect the checkbox beside a column name to show or hide a column.
Use the reordering
icon to move columns up and down the list. This changes the left-to-right display. An item at the top of the list, for example, means that it will be the first column on the left. Select Reset Order to restore the columns to their default positions.
Resize columns by hovering your cursor over the column boundary you want to adjust until it becomes a resize
cursor. Drag the boundary until the column is the width you want.Select the up/down
arrows in the column headers to sort column content.
To download and save a copy of the results, select Download . You have the option to save the report as either a PDF or CSV file.
User Risk Summary
As a customer admin, you can run a User Risk Summary and view the results in your Phishing Simulation interface. The report provides a summary of user data for your active phishing campaigns.
Go to Report Manager and from the Solution dropdown menu, select Phishing Simulation. From the Report dropdown menu, select User Risk Summary.
Make selections from the following filters to produce a concise set of results. You can use the Search
box to locate items in the dropdown menus.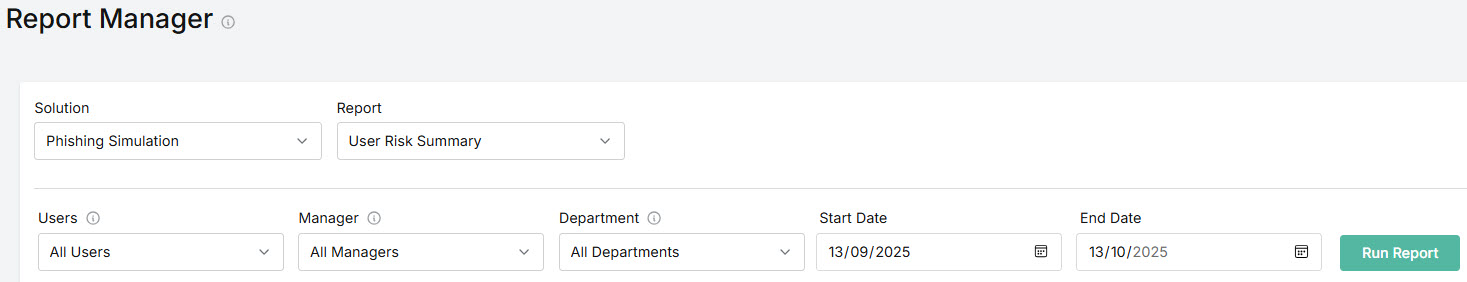
Users: Select the user(s) you want to include in the report results by clicking the checkbox(es) beside them.
Manager: Filter results by selecting the Microsoft 365 manager(s) from the dropdown list.
Department: Filter results by selecting the Microsoft 365 departments from the dropdown list.
Start Date: Select the start date for the report results.
End Date: Select the end date for the report results.
Select Run Report. The Report data is displayed as follows:
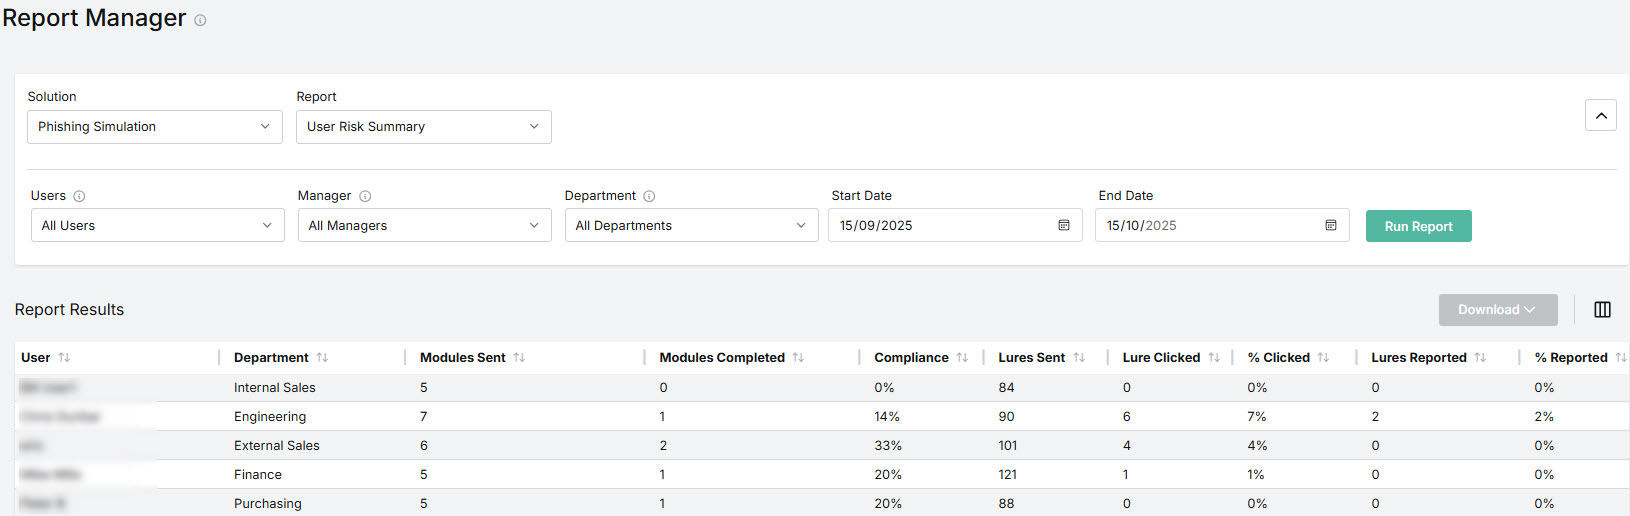
User: Name of user assigned an active phishing simulation campaign.
Department: Name of the user's department.
Modules Sent: Number of modules sent to the user.
Modules Completed: Number of modules completed on time.
Compliance: Percentage of modules completed on time.
Lures Sent: Number of lures sent to the user.
Lure Clicked: Number of lures clicked by the user.
% Clicked: Percentage of unique clicks by the user. A user may click on a lure multiple times; a unique click is the first click by a user.
Lures Reported: Number of lures that a user has correctly reported as phishing using the Outlook Add-in.
% Reported: Percentage of lures reported by the user.
You can manage how the table is displayed as follows:
Select the column
icon to manage table columns. By default, all columns are arranged in a specific order, but note that by default, the Manager and Email columns are not displayed.You can change the display by doing the following:
Select or deselect the checkbox beside a column name to show or hide a column.
Use the reordering
icon to move columns up and down the list. This changes the left-to-right display. An item at the top of the list, for example, means that it will be the first column on the left. Select Reset Order to restore the columns to their default positions.
Resize columns by hovering your cursor over the column boundary you want to adjust until it becomes a resize
cursor. Drag the boundary until the column is the width you want.Select the up/down
arrows in the column headers to sort column content.
To download and save a copy of the results, select Download . You have the option to save the report as either a PDF or CSV file.