MSP Dashboard
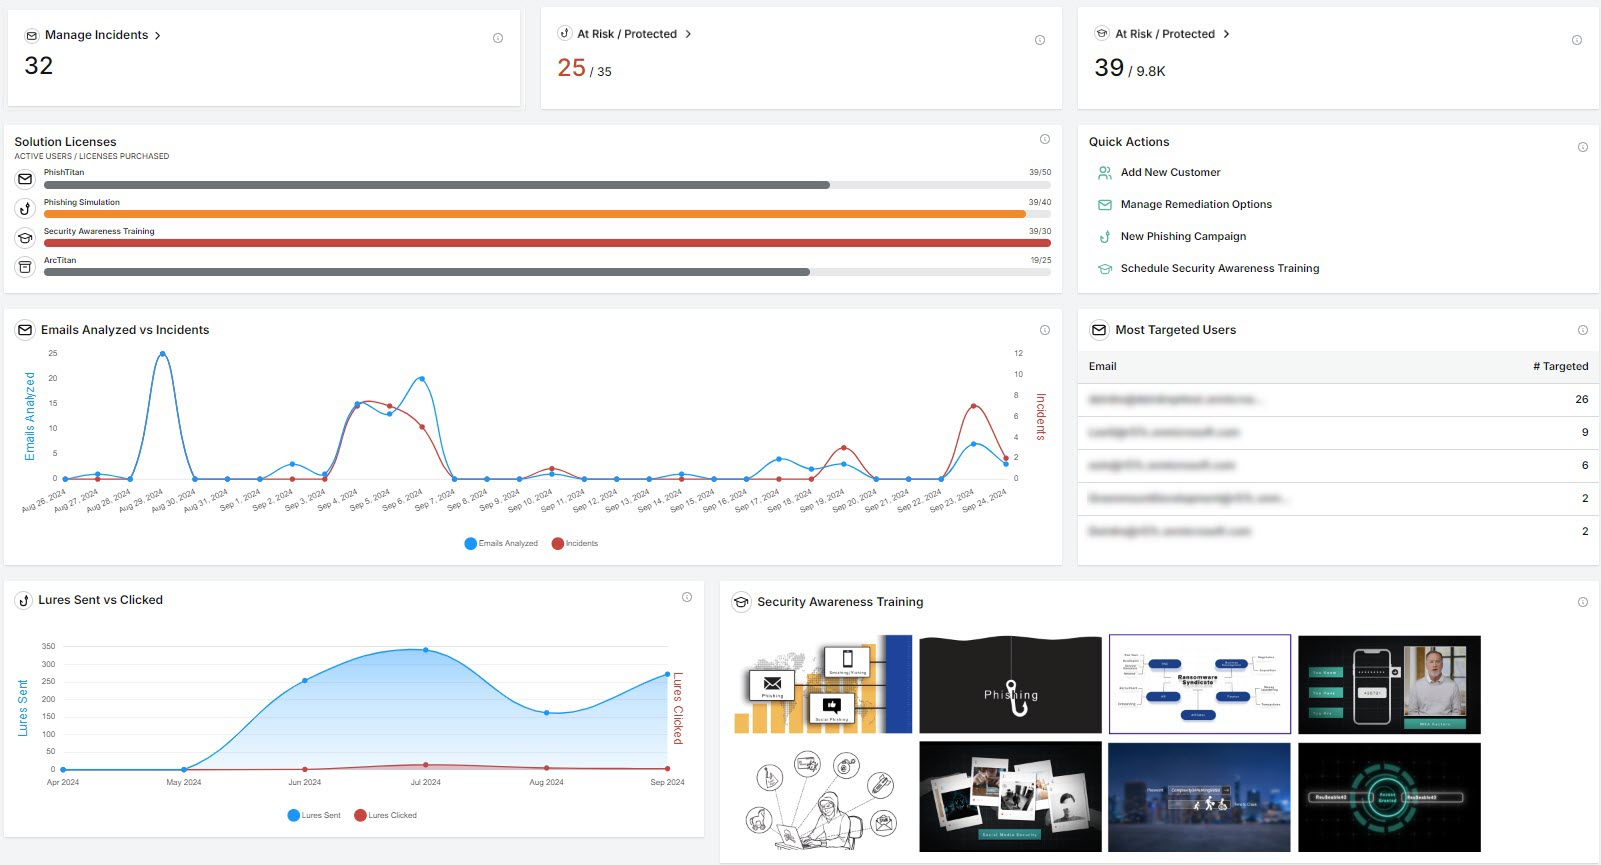
Your dashboard lets you see at a glance important details related to your TitanHQ solutions. A series of cards displays information related to each solution.

For solutions you haven't yet purchased, you can follow the Learn more  links for additional information.
The data displayed from left to right at the top of your dashboard relates to the following:
 Manage Incidents: Email Security
This is your total number of phishing incidents, including both resolved and those requiring action by you. When you select this card, you'll go to Email Security > Incidents. See Incidents for more information.
 At Risk / Protected: Phishing Simulation
With the Phishing Simulation solution, you can set up campaigns for your customers. The data shown here highlights the number of customers not enrolled in phishing simulation campaigns (at risk) compared to those who are enrolled (protected). Select this card to jump to Phishing Simulation > Overview where you can enroll at risk customers.
 At Risk / Protected: Security Awareness Training (SAT)
Scheduling SAT for your customers helps them to be more security conscious. The data shown here compares those not enrolled in security awareness training (at risk) and those who are. When you select this card, you'll go to Security Awareness Training > Overview where you can schedule SAT.
The next row of data displays the following:
Solution Licenses:
This graph illustrates the total number of active users and licenses purchased for each solution. See MSP License Usage for details.
Quick Actions:
To help you take action quickly on some tasks, the links in this section bring you to the first step of each task. This means you don't have to drill down through the solution's menu.
Add New Customer: Opens the Add Customer window on the platform level. See Add a Customer Account.
Manage Remediation Options: Brings you to Email Security > Configuration > Mail Flow > Remediation. Here you can manage how mails is processed before it is delivered to a user. See MSP Mail Flow.
New Phishing Campaign: Opens the Create Campaign window in Phishing Simulation. See Creating a Phishing Campaign.
Schedule Security Awareness Training: Opens the Schedule SAT window in the Security Awareness Training solution. See Schedule Security Awareness Training.
The third row of data cards relates to Email Security:
 Emails Analyzed vs Incidents
Comparison of the total number of emails processed to the number of incidents. Hover your mouse over the graph to display a summary for a particular date. If you select one of the labels (Emails Analyzed or incidents) then the linear data related to that label is removed from the graph.
 Most Targeted Users
The email addresses of those who have received the most phishing emails and the number of phishing attempts.
The final row highlights data related to Phishing Simulation and SAT:
SAT Modules Completed vs Lures Clicked
Comparison of the combined total of all the SAT modules completed to the total number of lures clicked over a specific period. If you select one of the labels (SAT Modules Completed or Lures Clicked) then the linear data related to that label is removed from the graph.