
Phishing Simulation Customer Overview
As a customer admin, you can follow the information here to create and manage phishing campaigns for your users.
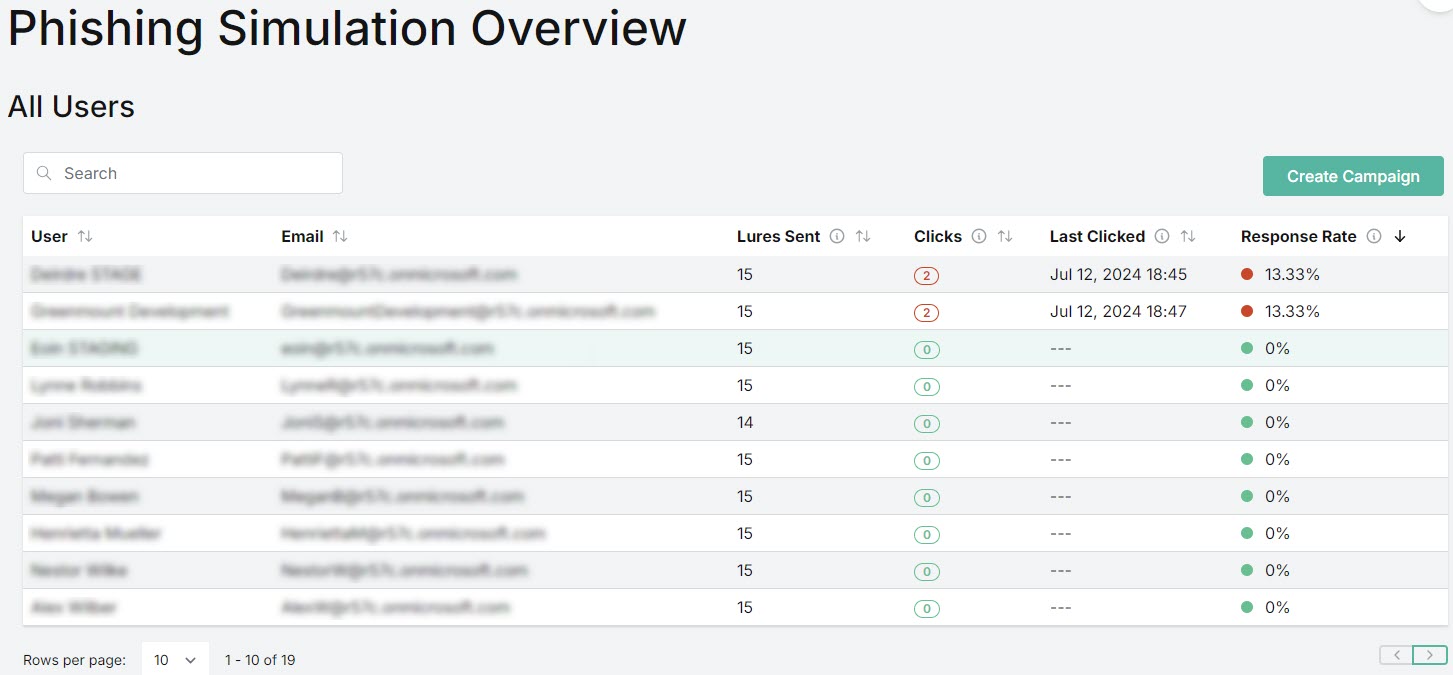
Select Phishing Simulation > Overview to see a summary of all active and completed phishing campaigns for all your users.
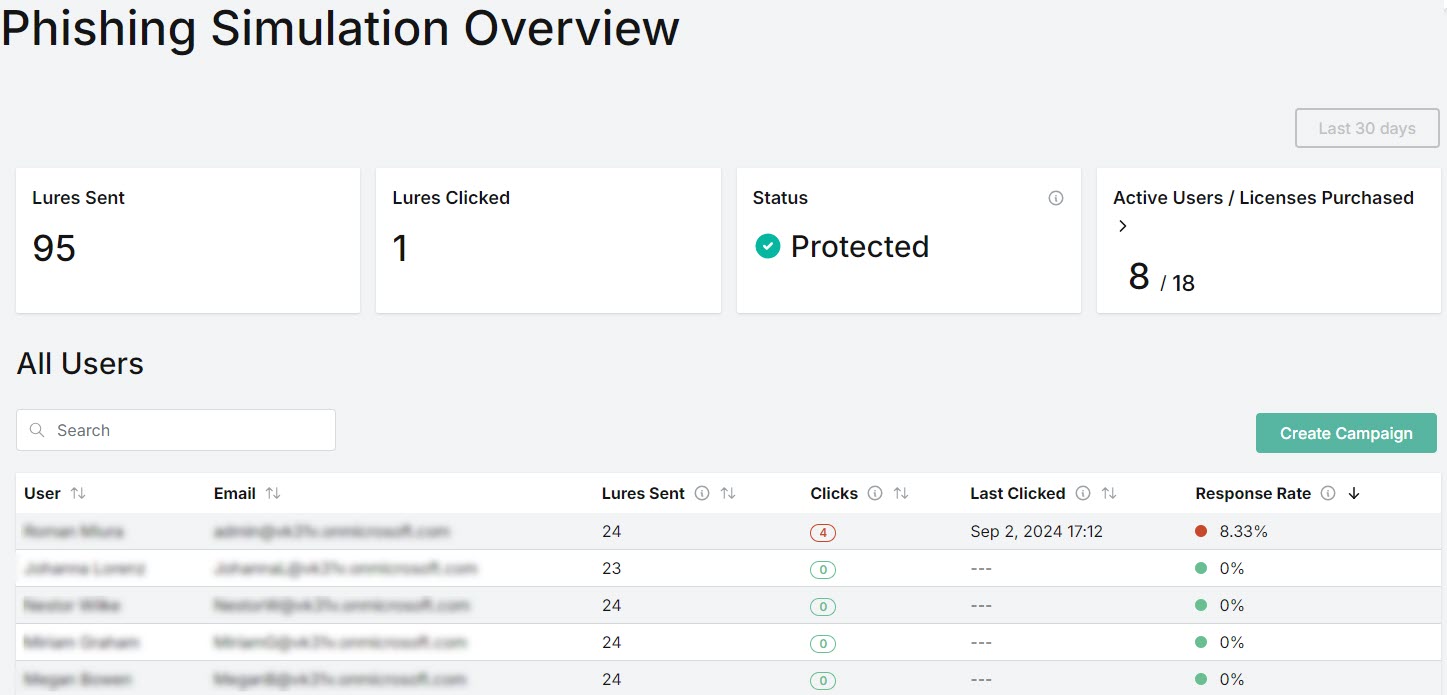
From this page you can do the following:
To create a new phishing campaign, select Create Campaign. See Creating a Phishing Campaign for further details.
To view sample lures for a better understanding of lure categories, select Sample Lures.
The following data cards display statistics for your users:
Lures Sent
The total number of lures sent to a user, including all their active and completed campaigns, based on the last 30 days.
Lures Clicked
Total number of unique clicks across all active and completed campaigns by all users, based on the last 30 days. A unique click is defined as the first click by the user. Multiple clicks are not included in this number and are tracked elsewhere.
Status
Indicates whether you are enrolled in an active phishing campaign (Protected) or not (At Risk).
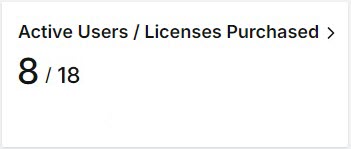
Active Users/Licenses Purchased
Compare the total number of your active users to the number of licenses you purchased from your MSP. Select this box to go to License Usage where you can monitor your relationship with your users based on licenses and usage.
Users Table
The Users table gives you a list of your users and indicates their phishing campaign status.
Note
Data in this table is sorted by default on the Response Rate, meaning that users who have interacted with lures the most are displayed at the top.
You can manage how the table is displayed as follows:
Use the Search
 box to search the list of users and the list of emails.
Select the column
 icon to manage how table columns are displayed. By default, all columns are visible and arranged in a specific order. You can change the display by doing the following:
Select or deselect the checkbox beside a column name to show or hide a column.
Use the reordering
 icon to move columns up and down the list. This changes the left-to-right display. An item at the top of the list, for example, means that it will be the first column on the left. Select Reset Order to restore the columns to their default positions.
Resize columns by hovering your cursor over the column boundary you want to adjust until it becomes a resize
 cursor. Drag the boundary until the column is the width you want.
Select the up/down
 arrows in the column headers to sort column content.
The following definitions are useful as you consider the data:
User: Name of the individual enrolled in the phishing campaign.
Email: User's work email address.
Lures Sent: Total number of lures sent to a user, including all their active and completed campaigns.
Clicks: Total number of unique clicks by a user, across all their active and completed campaigns.
Last Clicked: Date and time user last clicked on a lure.
Lures Reported: Number of lures reported as phishing using the Outlook Add-In.
Response Rate: Indicates the percentage of lures a user clicked on. When a green dot is visible, it means that the user has not interacted with a lure. A red dot indicates that a user has clicked on a lure.